Code Coverage in NAV 2016
If you remember in previous versions there is a tool called code coverage which was very useful tool to trace the code / debug the error for the developers, but in NAV 2013 and higher version this was not available but an alternative application profiler was available. If you want to learn more about that please visit my blog about this
http://www.archerpoint.com/blog/Posts/using-application-profiler-run-code-coverage-nav-2013-r2
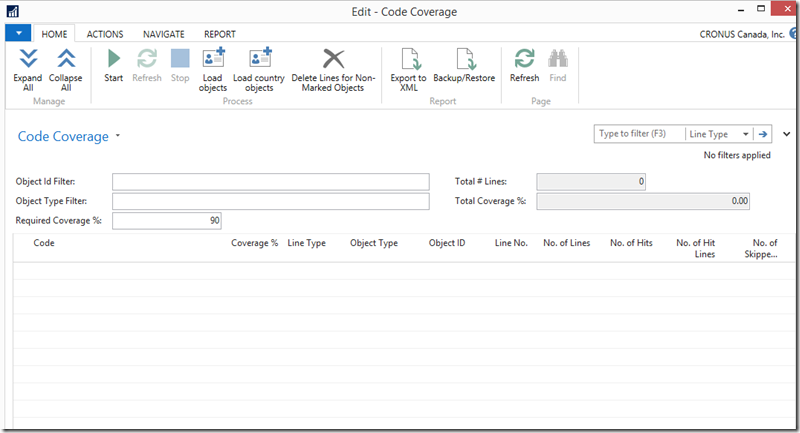
Good news is Code coverage is back again in NAV 2016. You can access the code coverage from Departments –>Administration –> Application Tools –> Code Coverage
It is easy to start, whenever you want trace the code for a specific action, just click the start button before the action and stop after the action. The code coverage page will list all the objects it got hit and will show the functions/triggers and coverage %. You can even filter the page for specific objects or line type.
I hope this tool will really help the developers/consultants to debug the code easily.
Please leave your comments, feedback or any suggestions you have for me to improve me my blog and also if you have any questions, feel free to post..


Leave a comment